Cooling For Comfort
June 19, 2020 | By Robert Bean
Cooling load calculations and A/C design should not be interpreted as being comfort design.
Likely one of the most widespread misconceptions within the HVAC industry is that cooling load calculations are proxies for a comfort calculation, and that A/C design is comfort design. Though both are required for selecting equipment, laying out mechanical room components and for duct routing, none of these tasks identify the discomfort metrics experienced by occupants in buildings.
How can I say that? Because none of these activities are required to ask what people thermally experience based on what they are doing, what they are wearing or where they are positioned relative to the architecture and geometry of the occupied space. For that analysis, the practitioners must look through the lens of ASHRAE Standard 55 Thermal Environmental Conditions for Human Occupancy.
ASHRAE 55 requires the practitioner to evaluate two personal factors, four general factors, and five local factors, as listed in Table 1.
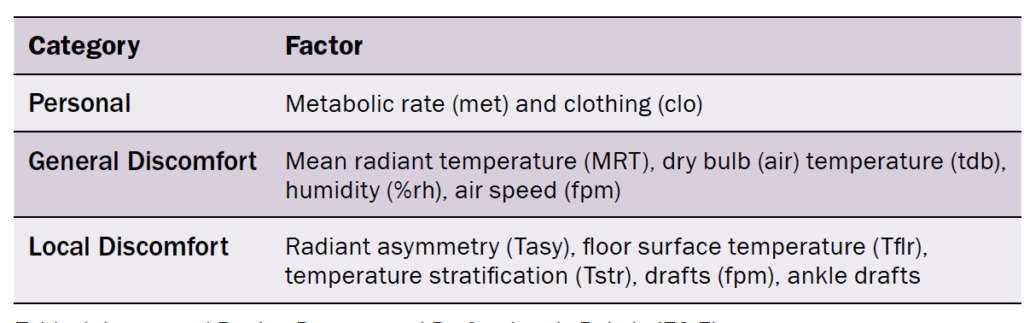
Table 1. Integrated Design Process and Professionals Role in IEQ Elements
When correctly considered, combined and controlled, these factors result in compliance with Standard 55 based on the work of Dr. P.O. Fanger and two indices; the predicted mean vote and predicted percentage of dissatisfied occupants (Figure 1).
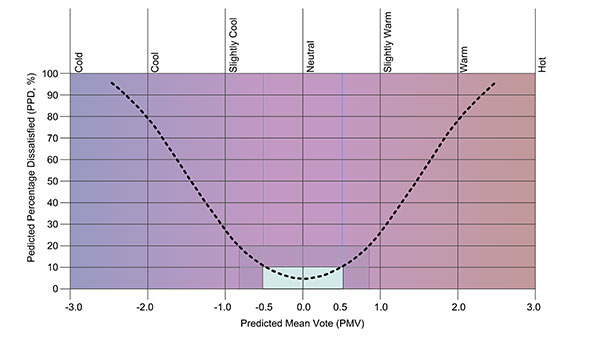
Figure 1: Dr. P.O. Fanger developed this graph to provide a measure for occupant comfort.
Dr. Fanger developed the Predicted Mean Vote (PMV, x-axis) and Predicted Percentage Dissatisfied (PPD, y-axis) indices to illustrate that when architectural, enclosure, interior and HVAC design can get all the comfort factors from Table 1 right, that most people vote within a 0.0 +/- 0.5 range on a seven-point scale (top of the graph) in comfort assessments. This vote corresponds to a 10% dissatisfaction which is within compliance of ASHRAE Standard 55. Occupant discomfort exceeding 10% corresponds to votes outside the recommended range.
Identifying the source of discomfort and then solving it first with architectural, enclosure and interior solutions are the primary task of every indoor climate consultant.
The 11 factors identified in Table 1, when known by calculation and specification, are inserted into the Centre for the Built Environment (CBE) online thermal comfort tool (Figure 2), which advises what a representative occupant might sense and perceive in a space and whether that experience would be in compliance with Standard 55. Equally important is that the assessment identifies sources of potential discomfort and can lead the designer to consider possible solutions.

Figure 2: Centre for the Built Environment thermal comfort tool, shaded zone shows compliance.
In cooling there are three primary concerns; the first two are illustrated in Figure 2 and Figure 3. These are the mean radiant temperature (MRT) and radiant asymmetry. These values determine the body’s ability to discharge heat for cooling via radiation.
What causes the MRT to rise, and what causes radiant asymmetry? In the first case it is overglazed high U-valued flamboyant architecture with poor fenestration and without external shading. In the latter case it will most likely be the occupant with an overheated pane of glass on one side of them and a cool conditioned space on the other.
The third concern is direct solar radiation absorbed by the occupant. This energy has to be accounted for in the MRT calculation, as shown later in Figures 8, 9, and 10.
These three concerns exist because the predominant mechanism for controlling the release or absorption of energy in the form of heat from the body is via radiation followed by respiration and convection.
This shifts over to respiration and evaporation and convection under extremely hot and dry conditions. Under hot and humid environments, the evaporation process becomes muted depending on the vapour pressures on the skin relative to the room.
Under all other conditions, the temperature difference between the mean skin temperature and surrounding mean radiant temperature regulates approximately 60% of the sensible heat transfer from the body to the enclosures.
Overheating occurs when the inside surface temperatures begin to rise, which reduces the body’s ability to discharge its excessive heat. It is the retention of heat that causes the perception of feeling hot.
To demonstrate these relationships, note of the following series of cooling challenges and compliances identified within an assessment for thermal comfort according to ASHRAE Standard 55.
Figure 2 (above) shows inputs for the two personal factors and four general factors. Note the noncompliance PMV > 0.5 with a corresponding predicted percentage dissatisfied, PPD >10%.
Note the red dot representing the person is outside the shaded comfort zone. This is due to the higher mean radiant temperature (MRT) and the upper end of the recommended humidity of 60% at a low airspeed, met rate, and clothing.
The high MRT is usually due to a large window-to-wall ratio of poor performing fenestration without external shading and no exterior insulation resulting in thermal bridging. The higher humidity under other circumstances would be acceptable, but with the combination of factors shown it is contributing to the discomfort. See in Figure 5 (below) how dehumidification helps in this example for improving satisfaction.
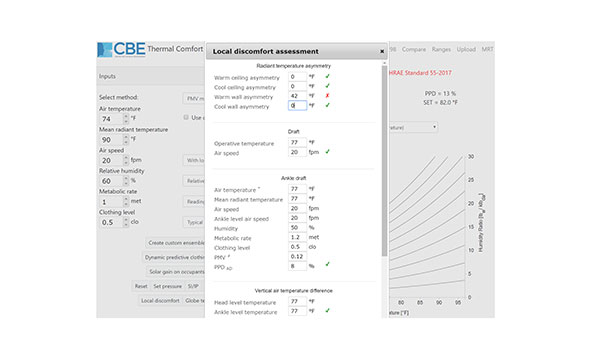
Figure 3: local discomfort assessment, note warm wall radiant asymmetry 42F is non-compliant.
In Figure 3 inputs for four of the five local discomfort factors are shown. Note the noncompliant radiant asymmetry of 42F.
This would occur when an occupant has a high surface temperature on one side and a cool surface or room on the other—common when large unshaded low performing windows are heated by direct solar radiation, raising the inside glass temperature well above room temperatures.
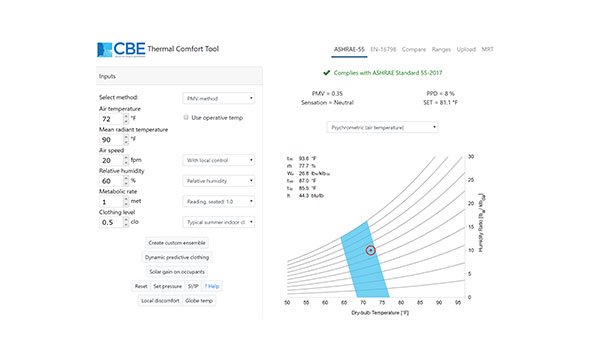
Figure 4: as per Figure 2 but with a decrease in Air temperature, bringing it into compliance.
Figure 4, as per Figure 2 but with a change in air temperature from 74F to 72F. Note the compliance PMV < 0.5 with a corresponding predicted percentage dissatisfied, PPD <10%. This is due to the lower air temperature compensating for the higher MRT. Here dehumidification is not necessary for compliance, but cooling is necessary.
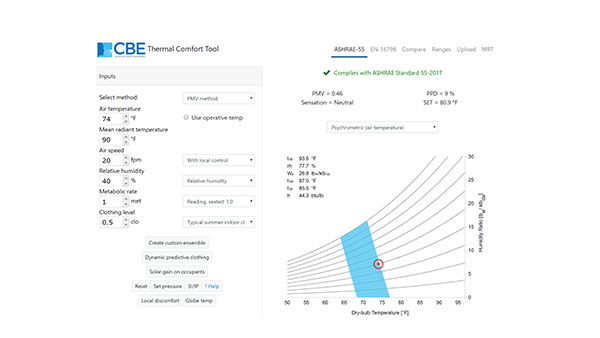
Figure 5: as per Figure 2 but with a change in relative humidity leading to compliance.
Figure 5, as per Figure 2 but with a change in relative humidity (RH) from 60% to 40%. Note the compliance PMV < 0.5 with a corresponding predicted percentage dissatisfied, PPD <10%. This is due to vapour pressure on the skin exceeding the vapour pressure in the room, enabling latent cooling through room dehumidification. Cooling load calculations and A/C design do not pick these relationships up.
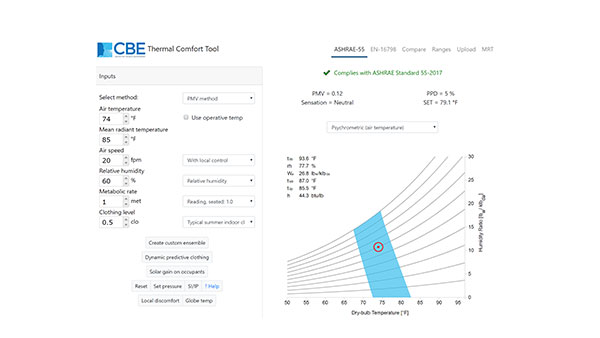
Figure 6: as per Figure 2 but with a change in the MRT leading to compliance.
Figure 6: as per Figure 2 but with a change in the MRT from 90F to 85F leading to compliance. This is due to the lower mean surface temperatures, which comes from shading, lower enclosure U values or radiant cooling systems and occupants with low clothing and met rates.
If the latter two increase, it is possible to shift into non-compliance. Cooling load calculations and A/C design would not pick up these relationships either, only a comfort assessment can assess these circumstances.
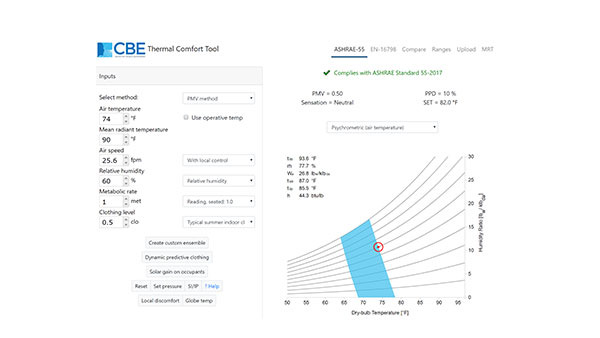
Figure 7: change in air speed from 20 fpm to 25.6 fpm leads to compliance.
Figure 7: As per Figure 2 but with a change in airspeed from 20 fpm to 25.6 fpm. Note the compliance PMV = 0.5 with a corresponding predicted percentage dissatisfied, PPD = 10%. This is due to the increase in convective flow across the occupant, which is made possible with floor, desk, or ceiling fans.
This illustrates that not all overheating challenges need be solved with energy-intensive refrigeration systems. Cooling load calculations and A/C design does not evaluate the use of personal fans but a comfort assessment can and does demonstrate their usefulness.
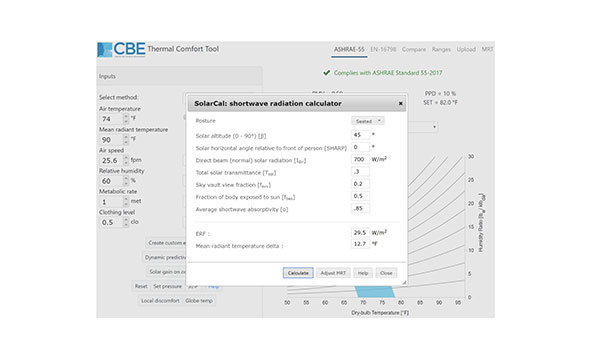
Figure 8: the SolarCal module evaluates the effect of radiant energy transmitted through glass.
Figure 8: Next to increases in the MRT and radiant asymmetry, the third leading cause of overheating is the absorption of shortwave energy in the form of electromagnetic (radiant) energy transmitted through the glass.
To evaluate this effect, the practitioner can use the SolarCal module built into the CBE tool. The results of this assessment adjust the MRT experienced by the occupant due to direct solar gains. Here, based on the inputs, it results in an increase of 12.7F in the MRT.
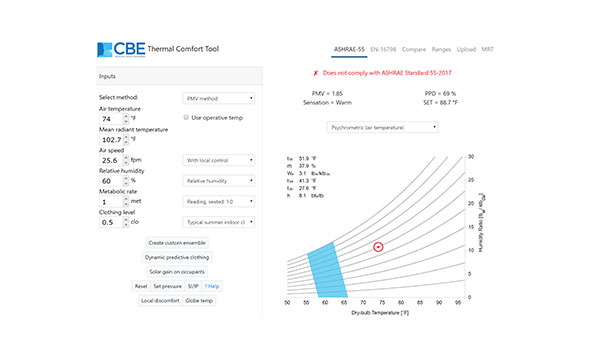
Figure 9: an increase to the MRT due to solar gain results in noncompliance.
Figure 9: as per Figure 7 but with a 12.7F upwards adjustment to the MRT (from 90F to 102.7F) due to the direct solar gain.
Note the noncompliance PMV > 0.5 with a corresponding predicted percentage dissatisfied, PPD >10%. This demonstrates to the client and architect the need for external shading. Internal window treatments can convert the shortwave to longwave and reduce some of the effect, but they won’t reduce the cooling load.
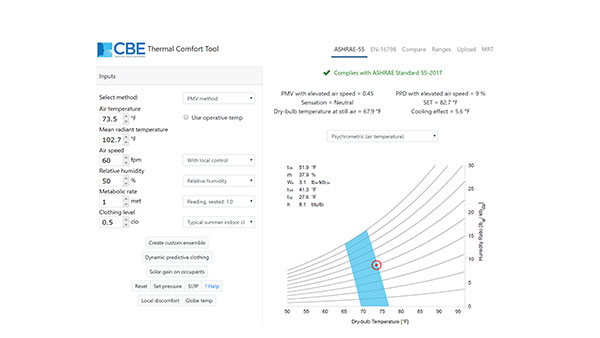
Figure 10: an increase in airspeed brings the previous scenario into compliance.
Figure 10: as per Figure 9 but with an increase in airspeed from 25.6 fpm to 60 fpm made possible with floor, desk or ceiling fans brings the environment into compliance.
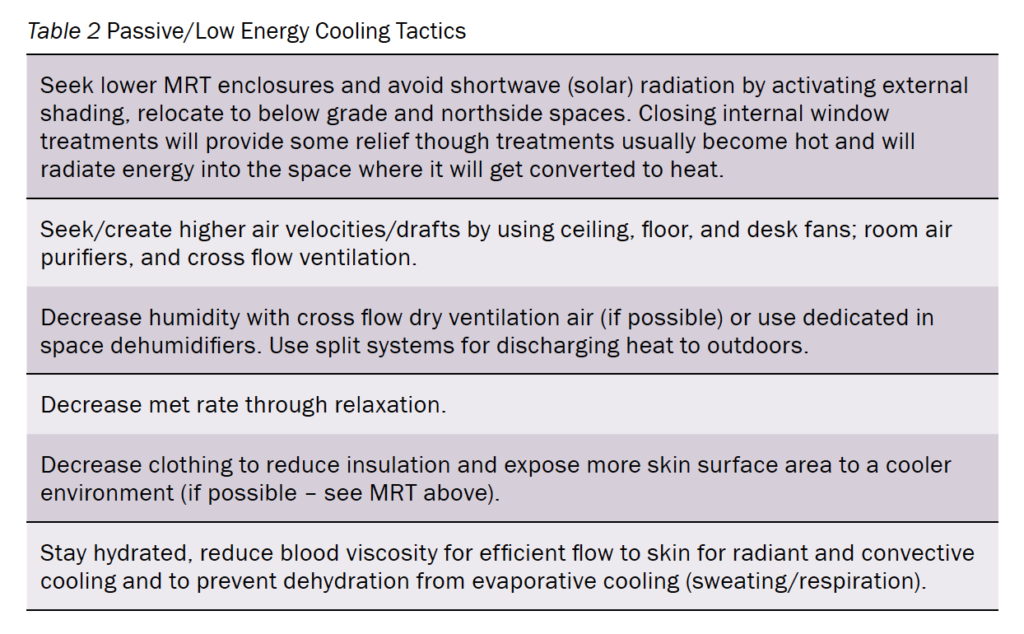
As noted in all of these examples, cooling load calculations and A/C design should not be interpreted as being comfort design. Designing for thermal comfort requires the practitioner to focus on the occupant and not the building (see Table 2).
This only makes sense since people sense the retention and gain of heat in their bodies ergo the building is not uncomfortable; people are uncomfortable.
For more on this subject, interested practitioners can obtain for no charge a new book on Thermal Comfort Principles and Practical Applications in Residential Buildings. This project was funded in partnership with BC Housing and can be accessed through this link: https://www.linkedin.com/groups/13843486/ <>